Insight
Group of wealthiest candidates have the lowest median income.
We compare the net income and net wealth of 2026 general election candidates.
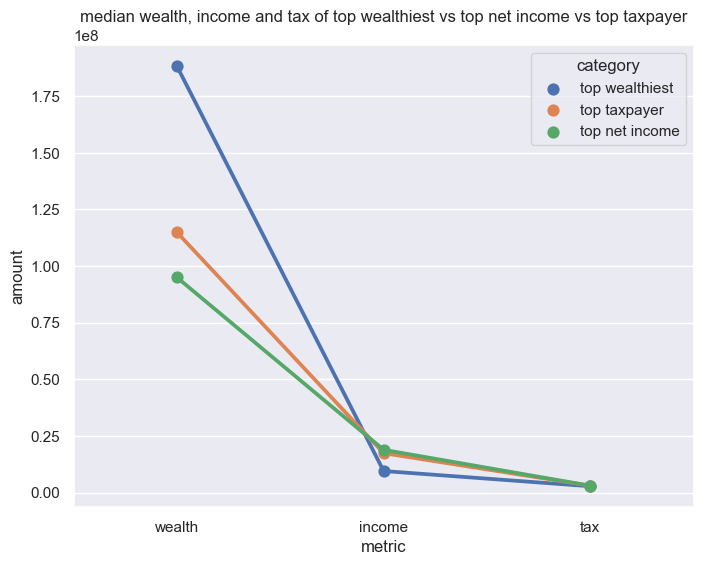
Comparison of the median income, wealth and tax paid between group of candidates with top income, top wealth or top taxpayer.
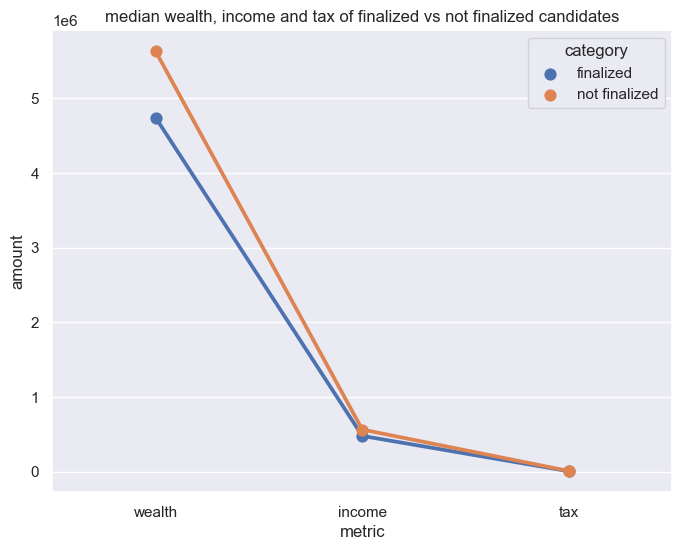
Comparison of the median income, wealth and tax paid between group of candidates who are finalized and rejected.
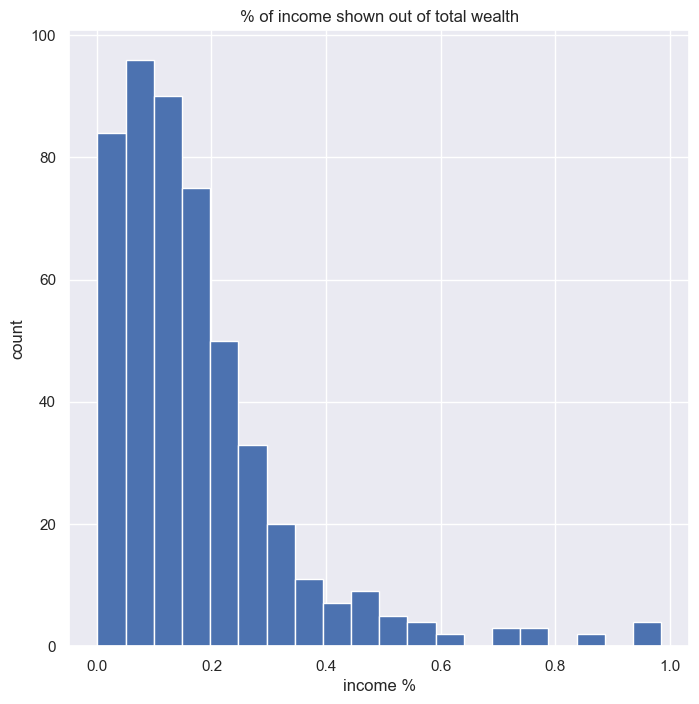
Distribution of the percentage of income out of net wealth of each candidate.
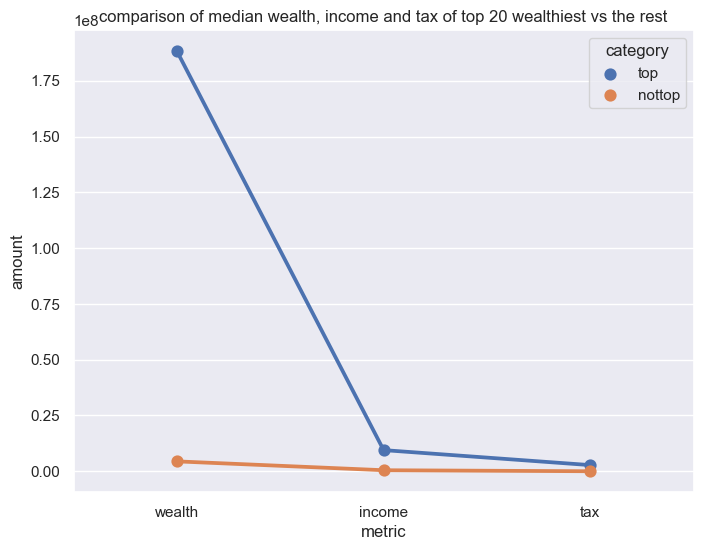
Comparison of the median income, wealth and tax paid between group of wealthiest and not wealthiest candidates.