Insight
Most candidates have a net income of 4-7 lacs per annum.
We visualize the net income and net wealth distributions of 2026 general election candidates.
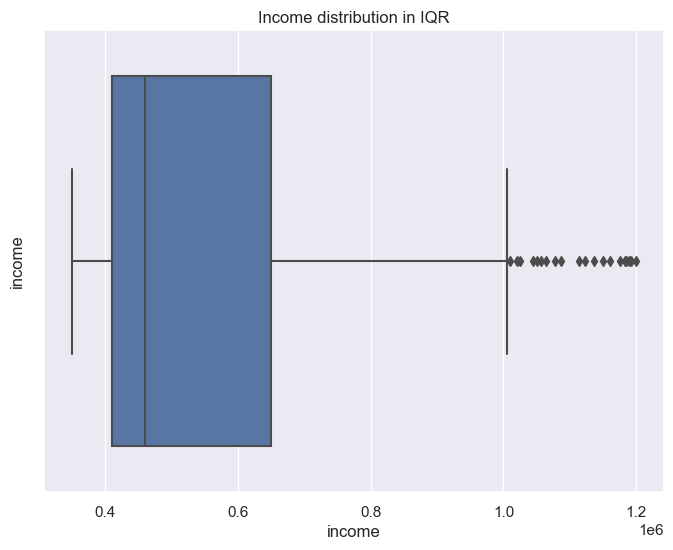
Distribution of the net income in between Q1 and Q3 (inter quantile range).
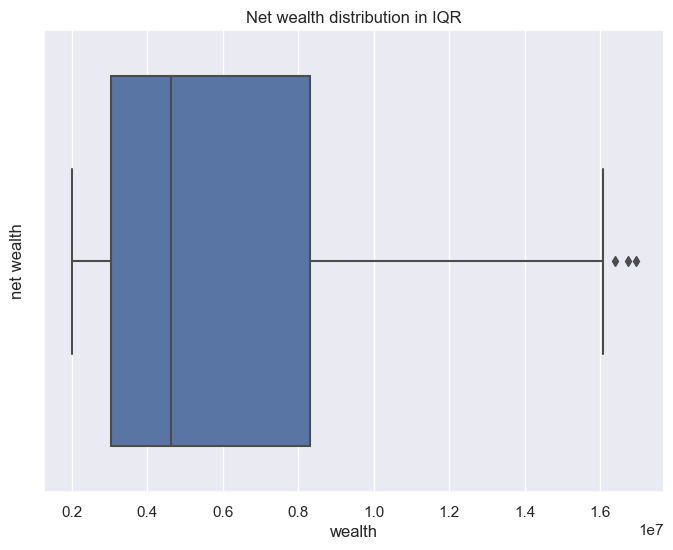
Distribution of the net wealth in between Q1 and Q3 (inter quantile range).
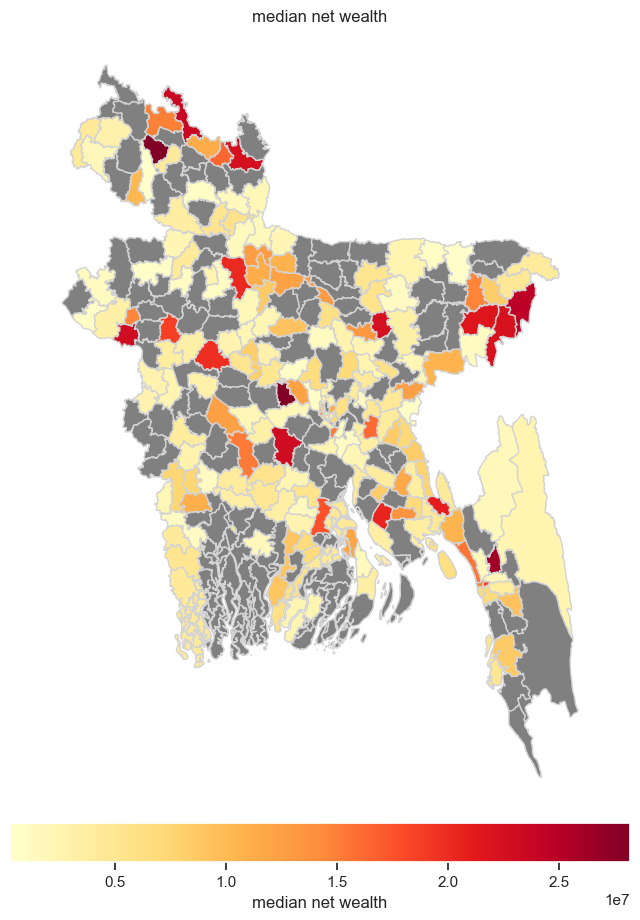
Map highlighting the median net wealth of the candidates of each seat. Seats with darker shades have candidates with higher net worth on average.
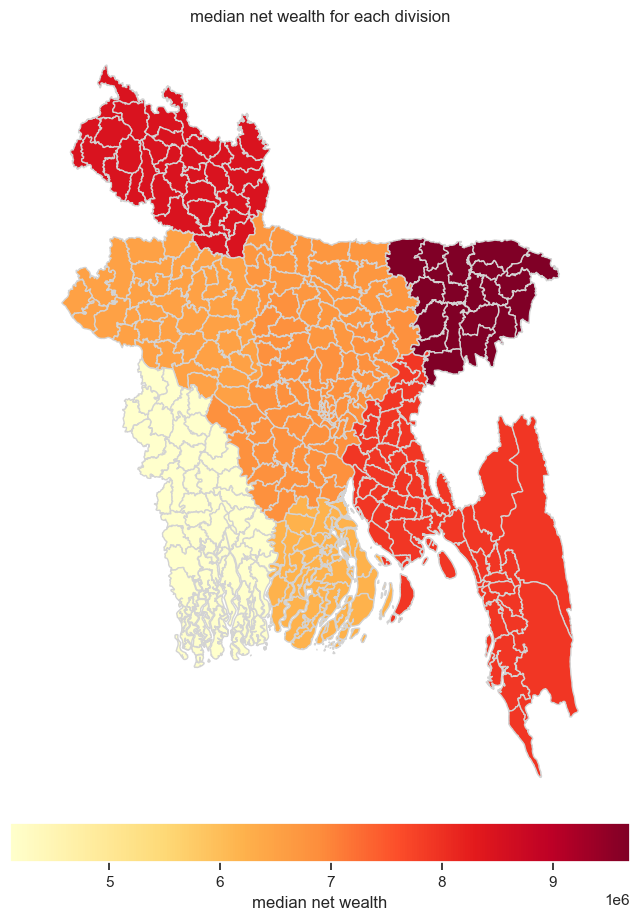
Map highlighting the median net wealth of the candidates of each division. Divisions with darker shades have candidates with higher net worth on average.