Regional (urban/rural) analysis

Portrays how BNP and AL perform in urban and rural seats.

mainp_region_count.png

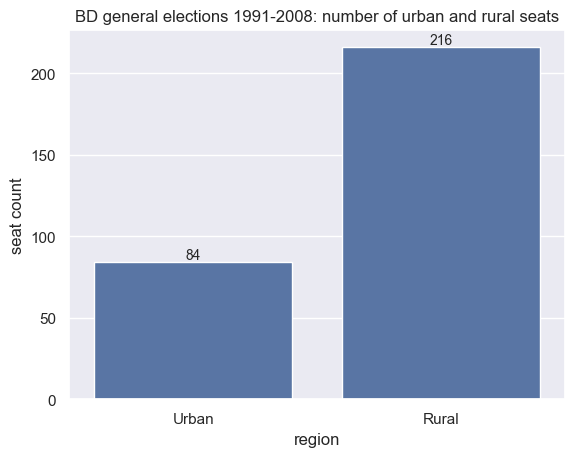
Bar chart visualizing the number of seats in urban and rural areas.

Insight

72% seats are in the rural areas and 28% seats are in the urban areas.

mainp_region_win.png

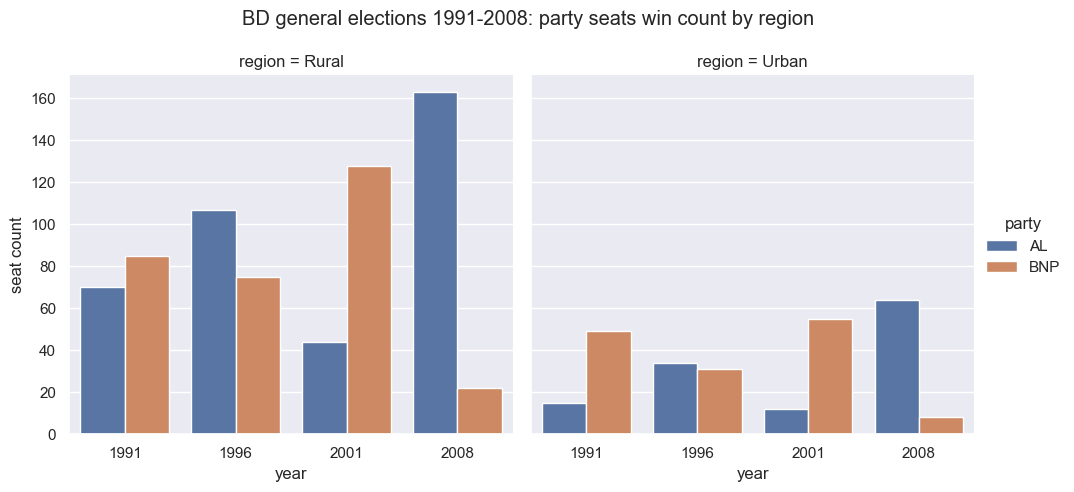
Bar chart visualizing the number of seats won by AL and BNP in urban and rural areas.

Insight

Election win is largely determined by the rural seats as these are in majority. Though the win difference between both parties in rural seats were low in the first two elections, the election winning party won most of the rural seats in the last two elections. BNP seems to be doing a better job in the urban seats.

mainp_region_win_avg.png

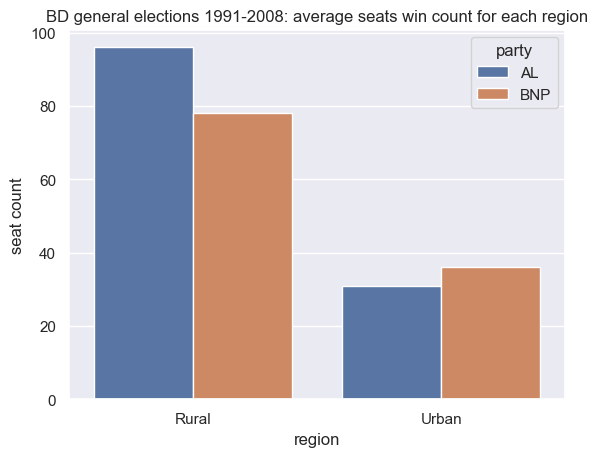
Bar chart visualizing the average number of seats won by AL and BNP in urban and rural areas.

Insight

AL performs well in rural areas where BNP has more wins in urban areas on average.

mainp_region_votepc.png

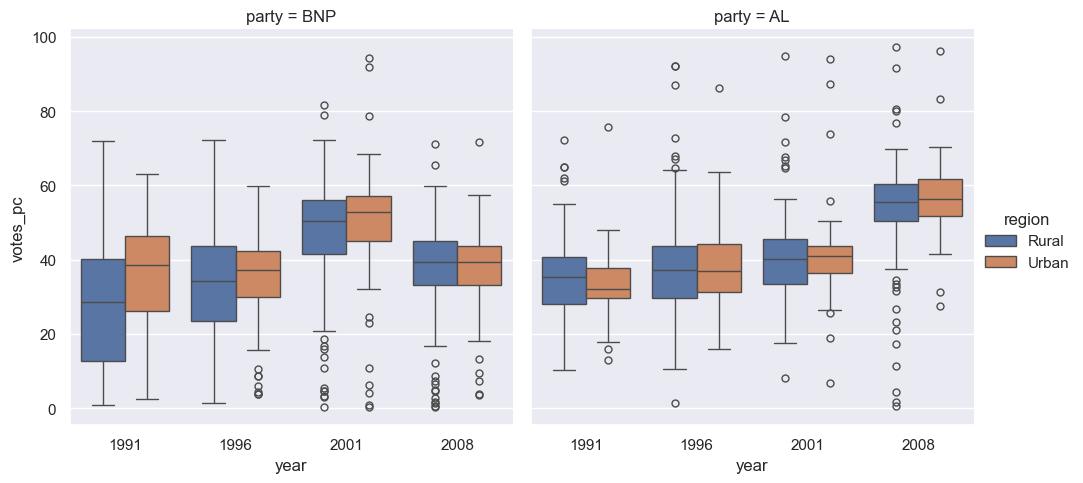
Distribution of vote percentages of AL and BNP in urban and rural areas.

Insight

BNP consistently performs better in urban regions compared to AL. However, AL has improved in urban years in the later years.

mainp_region_votepc_avg.png

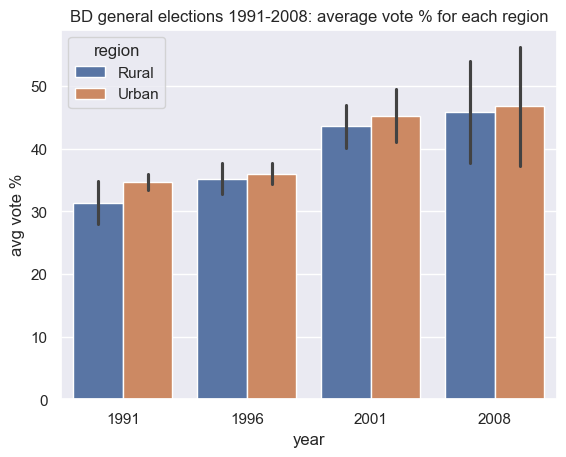
Bar chart visualizing average vote percentages of AL and BNP in urban and rural areas.

Insight

Urban areas have higher average vote percentages than rural areas, indicating lower number of wasted votes and less interest of the voters in smaller parties.