Turnout analysis (average and variance)

Turnout refers to the % of voters casting their votes out of the total registered voters. Inspecting the turnout average and variance will reveal the willingness of voters going to the polls.

turnout_pc_med_hist.png

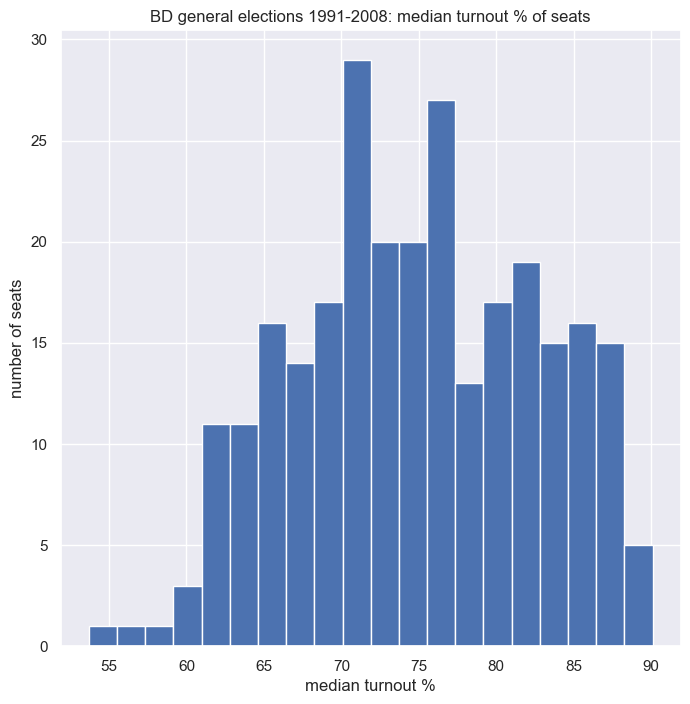
Histogram showing the median turnout % of the seats in 4 elections.

Insight

It is evident that most seats have a median turnout of 70-75%.

turnout_pc_med_map.png

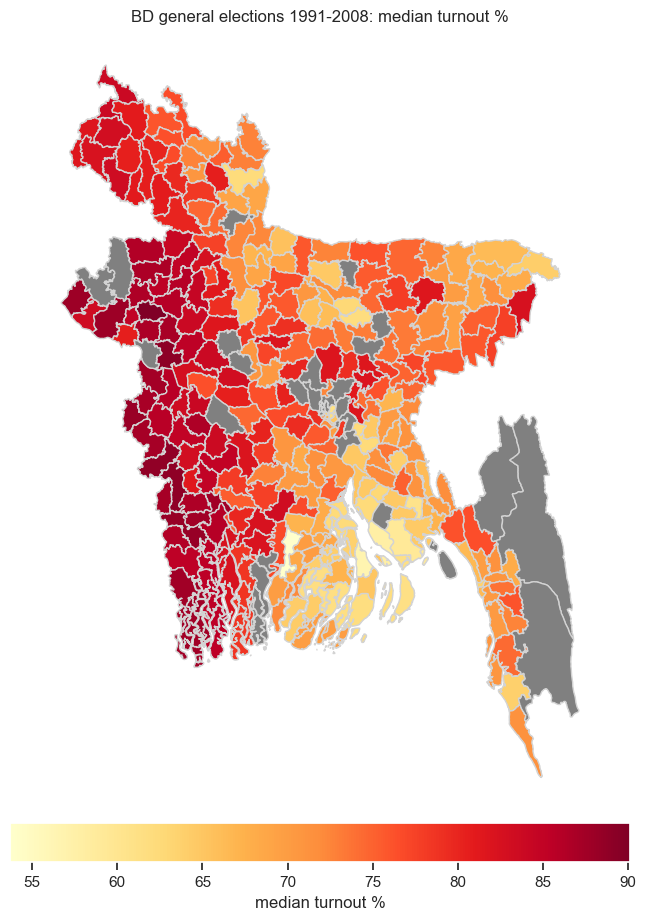
Highlighting the median turnout % of each seat.

Insight

As we move from west to east of BD, voters are less interested in showing up on the polls.

turnout_pc_div_med.png

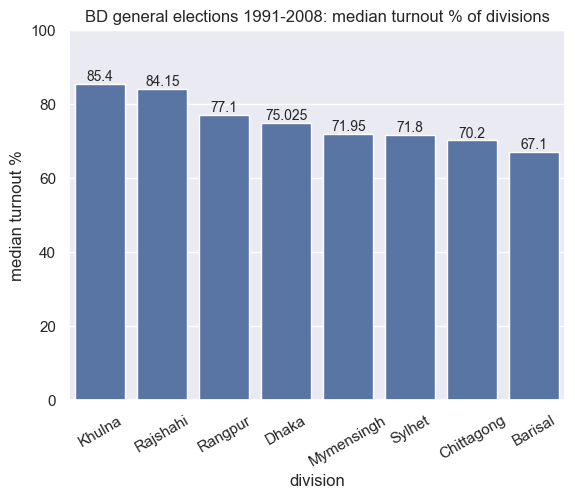
Bar chart highlighting the median turnout % of each division.

Insight

Khulna and Rajshahi divisions have the highest average turnout, followed by Rangpur and Dhaka. Barishal division has the lowest average turnout.

turnout_pc_med_div_map.png

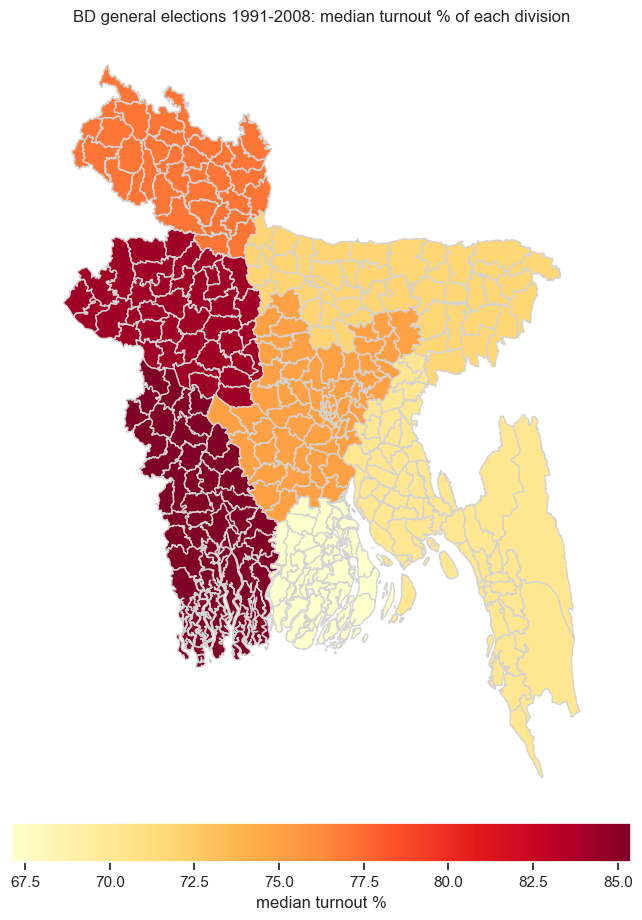
Map highlighting the median turnout % of each division.

Insight

Khulna and Rajshahi divisions have the highest average turnout, followed by Rangpur and Dhaka. Barishal division has the lowest average turnout.

turnout_pc_std_hist.png

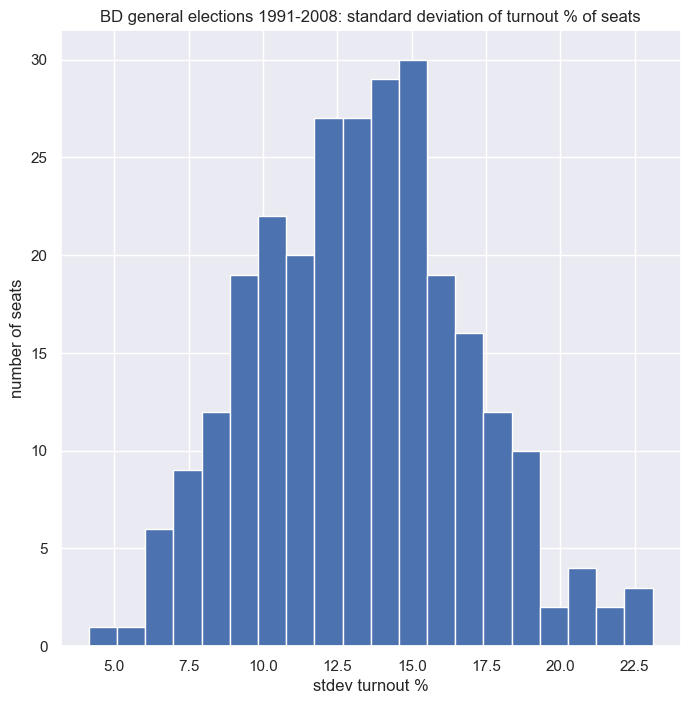
Histogram showing the standard deviation of turnout % of the seats in 4 elections.

Insight

It is evident that most seats have a turnout with a standard deviation of 12.5-15.

turnout_pc_std_map.png

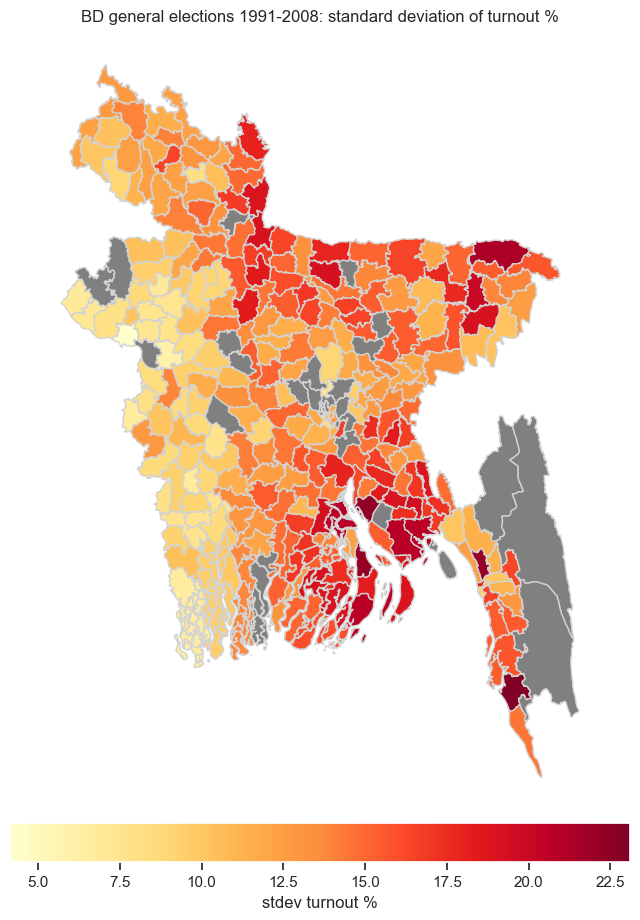
Highlighting the standard deviation of turnout % of each seat.

Insight

Seats in the Comilla, Barishal, Chittagong, Mymensingh region have more variance in turnout.

turnout_pc_std_div_map.png

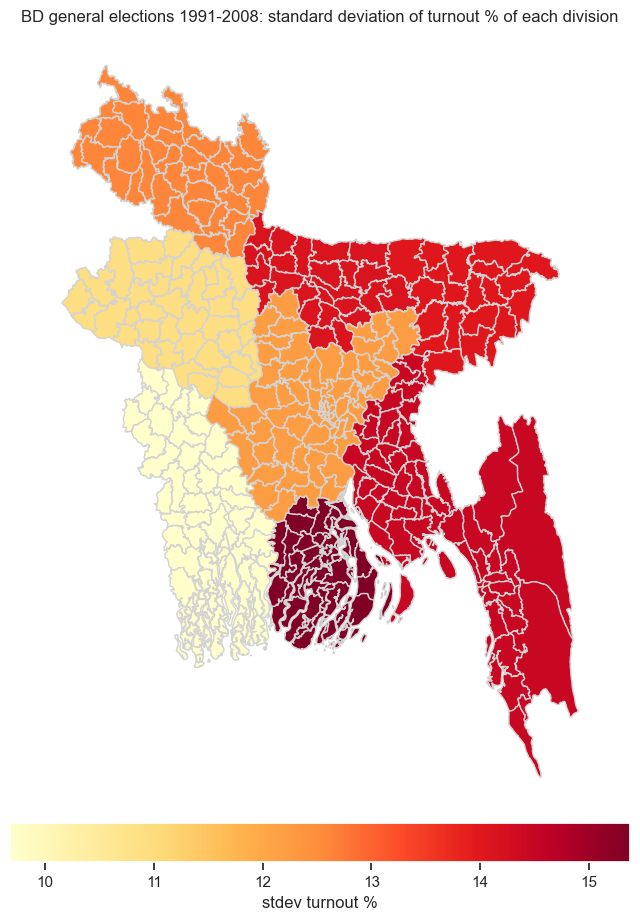
Highlighting the standard deviation of turnout % of each division.

Insight

Khulna and Rajshahi divisions have the lowest variance in turnout, followed by Rangpur and Dhaka. Turnout varies the highest in Barishal division.