Insight
Most seats have a median vote difference <20%, indicating that most seats have close contest between the top 2 candidates.
Analyzing the vote difference % and looking into the close battles and landslide victories.
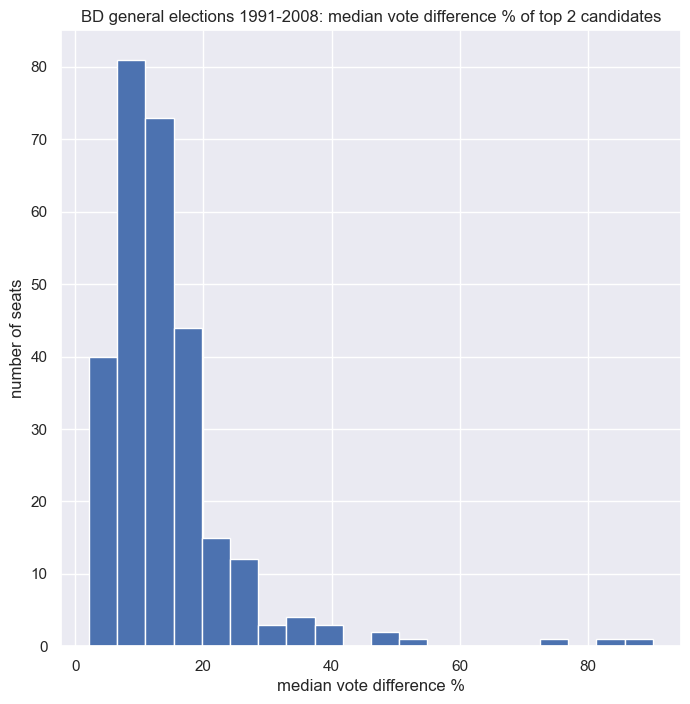
Histogram showing the distribution of median vote difference of each of the 300 seats.
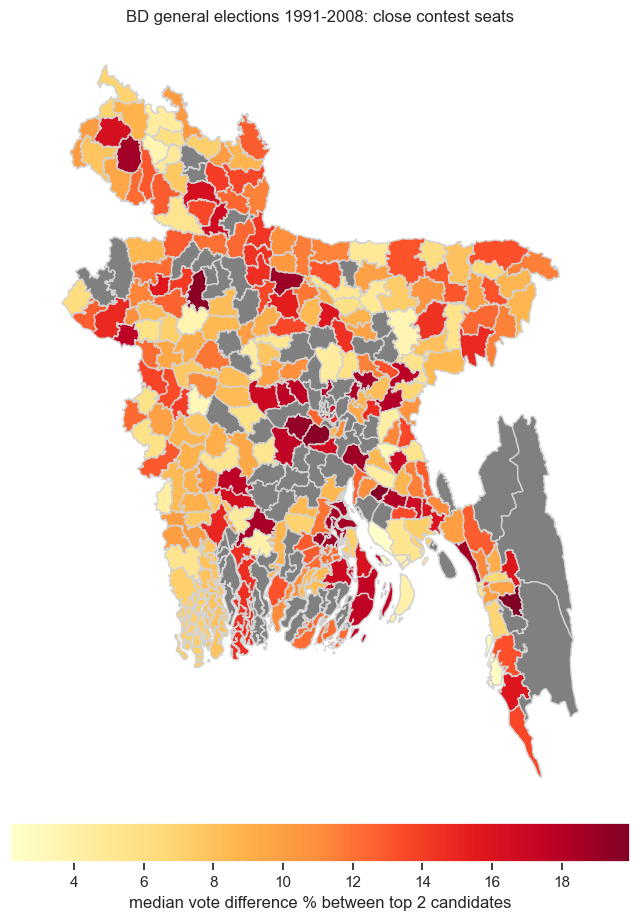
Map visualizing the seats that have a close contest (average vote difference <20%). Seats with lighter shade have closer contest on avarage than seats with a darker shade.
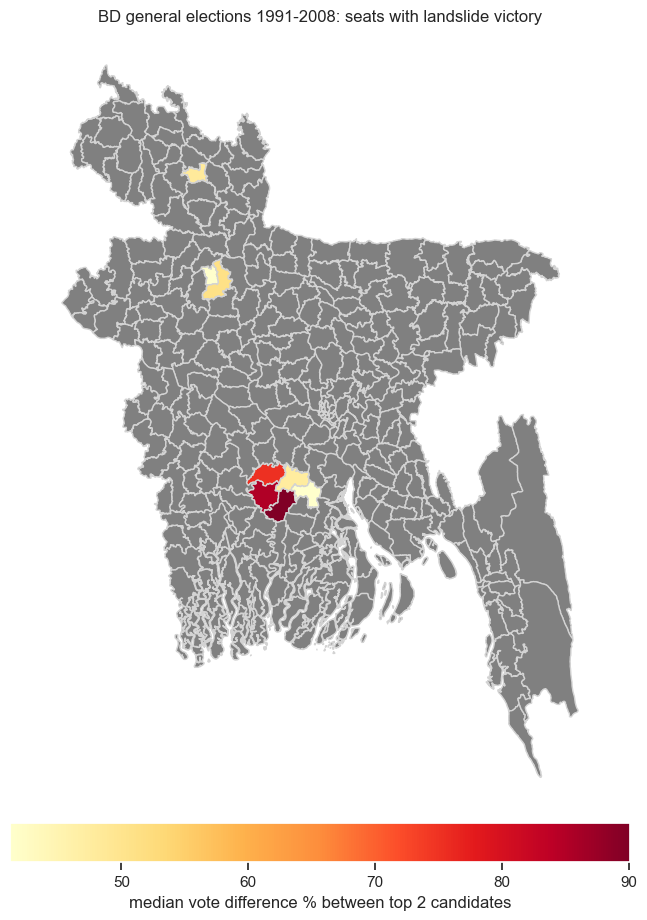
Map visualizing the seats that have a landslide victory i.e. winners winning by a huge margin (>40% vote difference).